
 |
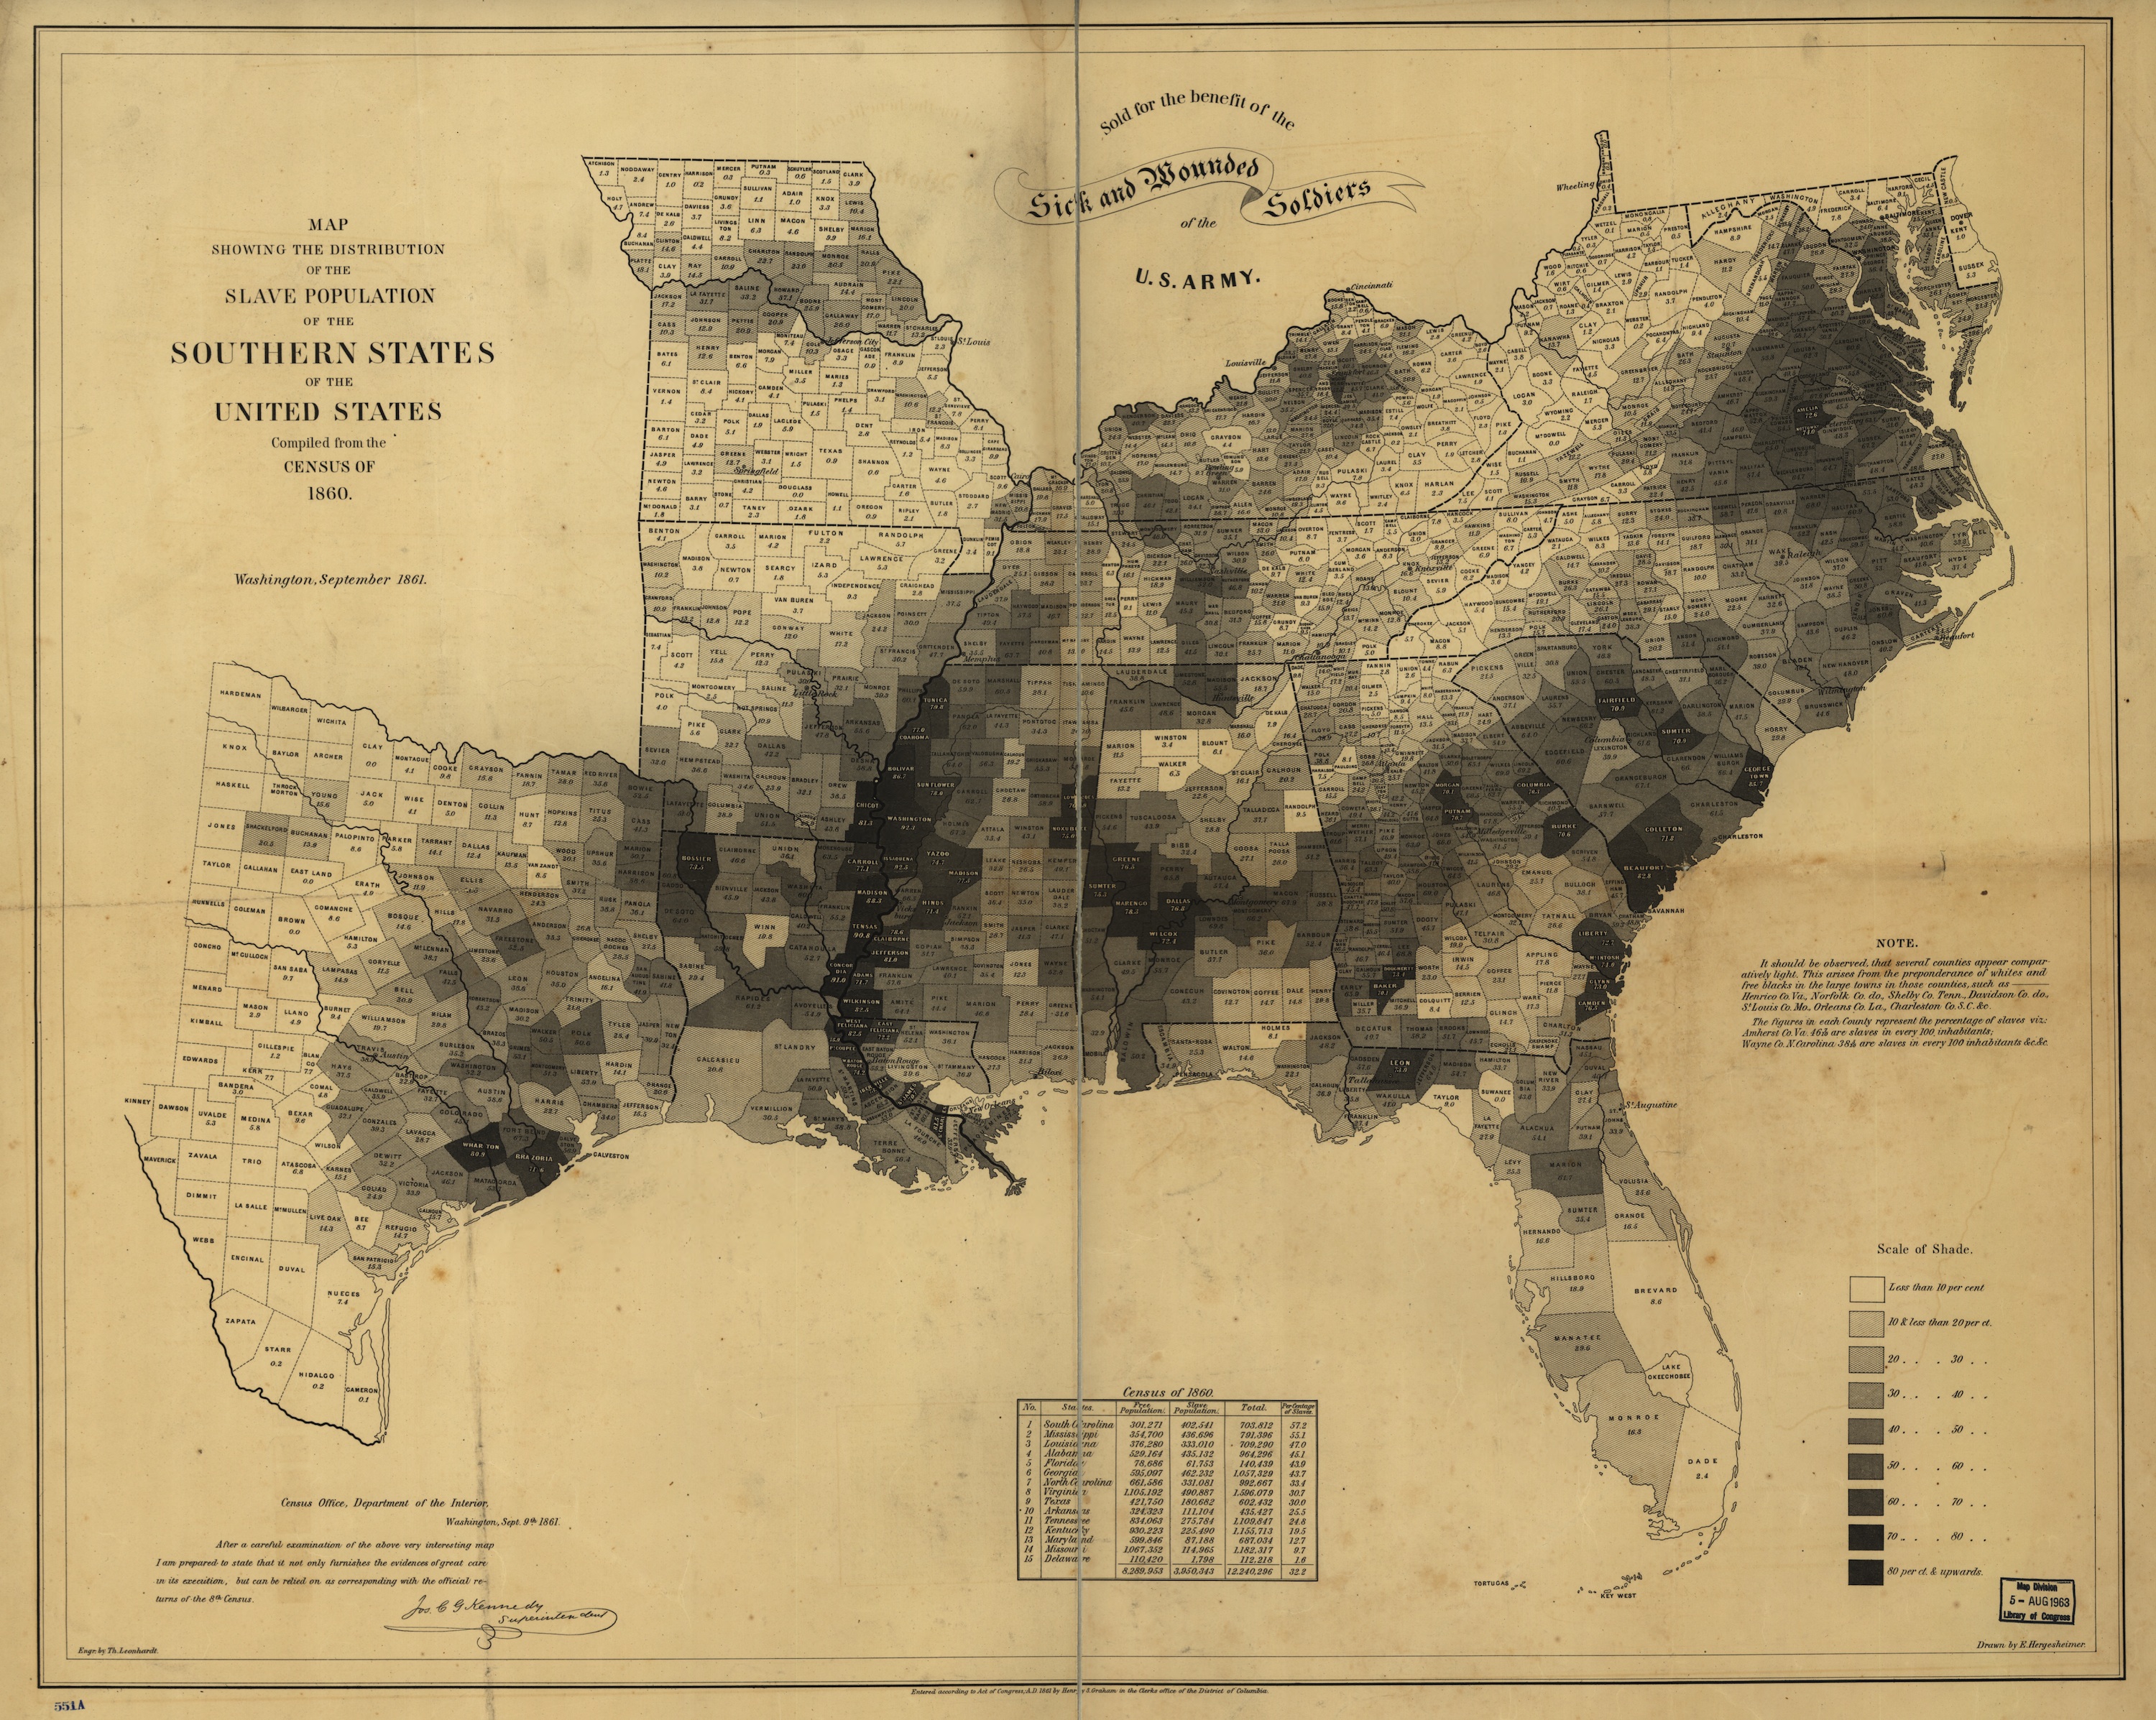
| Arrows overlaid on the slavery map mark the general movements of Stoneman's Raid |
We've all seen those color-coded computer-generated maps that give us a county-by-county snapshot of voting results, educational achievement, tornado warnings, or other indicators. It's all based on GIS, which stands for Geographic Information Systems.
More than a century before GIS was invented, Abraham Lincoln's cartographers explored the concept on this map, which illustrates the prevalence of slavery from Delaware to Texas. Lincoln often referred to the map, and the government sold copies as a fundraiser for sick and wounded soldiers. Francis Bicknell Carpenter even included the slavery map in his historic painting of Lincoln's cabinet (see below).
The photo above is a closeup of the map, which was drawn by the U.S. Coast Survey in 1861 based on the 1860 census. The darkest counties are those with the highest percentage of slaves in the total population. To see the full map, click here.
This map illustrates one of the reasons why Stoneman's Raid met relatively light resistance. He was never deep in plantation territory, and few of the Southerners in his path had reason to defend slavery. For example, slaves were just 17 percent of the population in Knox County, Tenn., 2 percent in Watauga, N.C., 18 percent in Wythe, Va., 27 percent in Rowan, N.C., and 32 percent in Greenville, S.C.
Across the Confederacy, slaves represented 39 percent of the population (though they counted as only 24 percent under the "three-fifths compromise" that was so important in pre-war politics).
By comparison, Sherman marched through parts of Georgia and South Carolina where the majority of the population were slaves. In Beaufort, S.C. (which included what is now Allendale and Jasper), it was 82.5 percent.
When this map was drawn, West Virginia was still part of Virginia. It was admitted to the Union in 1863 as the 35th state.
If you look closely, you may notice that many counties were not yet born in 1861, including Avery, Mitchell, Transylvania, Swain, Clay and Graham in the mountains of North Carolina; and Oconee, Cherokee, Greenwood, McCormick, and Saluda in western South Carolina.
 |
| The slavery map is visible in the lower right corner of Francis Bicknell Carpenter's 1864 painting, First Reading of the Emancipation Proclamation of President Lincoln. Stoneman's nemesis, Secretary of War Edwin Stanton, is at the far left. Treasury Secretary Salmon P. Chase is standing behind Lincoln. To the right, Interior Secretary Caleb Blood Smith and Postmaster General Montgomery Blair are standing, and Navy Secretary Gideon Wells, Secretary of State William Seward, and Attorney General Edwin Bates are seated. The painting hangs today in the U.S. Capitol, in the West staircase of the Senate wing. |
No comments:
Post a Comment